Nutrition monitoring
based on satellite data
Nutrisat is a service, conceived and developed, within the European project Fatima (FArming Tools for external nutrient Inputs and water MAnagement) in order to be able to warn-rare, through the use of satellite images, crops (Tomato and Wheat) in deficit Nutritional. The service is easily searchable through an interactive web-app, thanks to which it is possible, using the most common digital means, to easily identify crops that are in deficit of nitrogen and therefore growth.
PROS
- Optimize fertilizer usage, thereby reducing business costs;
- Check, in a few seconds, the growth status of the crops of the entire company;
- Easily comply with the directives on the use of nitrates, imposed by the European Union.
PROS
- Optimize fertilizer usage, thereby reducing business costs;
- Check, in a few seconds, the growth status of the crops of the entire company;
- Easily comply with the directives on the use of nitrates, imposed by the European Union.
HOW IT WORKS
The system is based on the calculation of a Vegetation Index, the Nitrogen Nutrition Index (NNI), used to warn the concentration of nitrogen in the vegetative phase of crops. The calibration of the satellite data on which the system is based was carried out together with the Council for Agricultural Research and Economic Analysis CREA (www.crea.gov.it) during the three years of the European Fatima project with data collected in the field on wheat and pom-dore. Below are two nutritional maps in different vegetative states of culture.
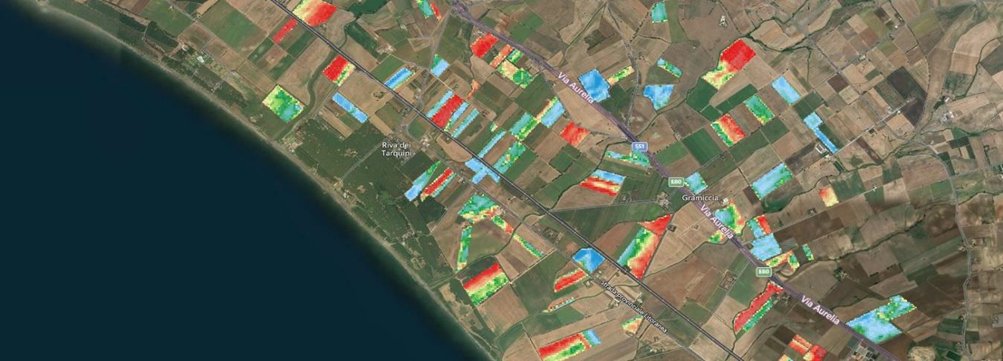
Nutritional Index Map (NNI). The crop is growing. The red areas indicate that the nitrogen concentration is too low to allow it to develop. The yellow and green areas indicate a good and excellent growth condition respectively.

Nutritional Index Map (NNI). The crop is in the phase of maximum growth. The blue and blue areas indicate a surplus of nitrogen due to excessive fertilization.
HOW IT WORKS
The system is based on the calculation of a Vegetation Index, the Nitrogen Nutrition Index (NNI), used to warn the concentration of nitrogen in the vegetative phase of crops. The calibration of the satellite data on which the system is based was carried out together with the Council for Agricultural Research and Economic Analysis CREA (www.crea.gov.it) during the three years of the European Fatima project with data collected in the field on wheat and pom-dore. Below are two nutritional maps in different vegetative states of culture.
Nutritional Index Map (NNI). The crop is growing. The red areas indicate that the nitrogen concentration is too low to allow it to develop. The yellow and green areas indicate a good and excellent growth condition respectively.
Nutritional Index Map (NNI). The crop is in the phase of maximum growth. The blue and blue areas indicate a surplus of nitrogen due to excessive fertilization.
WHOM IT IS FOR
Farmers, Cooperatives, Research Bodies, Land Control Bodies.
WHOM IT IS FOR
Farmers, Cooperatives, Research Bodies, Land Control Bodies.

Do you need more information? Contact us
Contact us by sending an email to commerciale@ariespace.com
Address: Centro direzionale is. A3 80143 Napoli, Italia
Phone: 081 195 64 282 / 081 562 8563
e-mail: commerciale@ariespace.com
Open: 9.00-13:30; 15.00-18,00 MON-FRI